
Investing in private equity for the world’s largest company has been a fascinating and challenging experience. At our core, we are an investment organization within an oil company, operating in an interesting part of the world.
From the outset, and to this day, I face the question: “How do I effectively utilize my Spartan team and small travel budget to rapidly build and scale a top-tier private equity allocation within an engineering-minded company located thousands of miles away from potential investments?”
Underlying my strategy are five foundational principles that I have studied theoretically, experienced professionally and believe in whole-heartedly. Once those building blocks are established, there are common mistakes that LPs must avoid on the path to building a model private equity portfolio.
Five Principles
1. Returns Are Persistent – Top-quartile managers are likely to remain top performers, according to industry data first highlighted by University of Chicago researcher Steven Kaplan and MIT economist Antoinette Schoar. A remarkable 36.7 percent of top-quartile managers remain top quartile and 62.3 percent continue to outperform the median (Figure 1).
That outperformance requires no significant shifts in strategy, team and market; and a historical track record long enough to demonstrate true value-add that is not concentrated in one individual or a function of market tailwinds.
It is equally true that managers who continually underperform the median are more likely to continue. Nearly half of bottom-quartile managers remain in the bottom and 62.8 percent continue to lag the median (Figure 1). As I will demonstrate below, when allocating to venture capital, the principle of “go top quartile or go home” is particularly vital.
Figure 1 – Persistence Of Returns

Source: Hamilton Lane Fund Investment Database
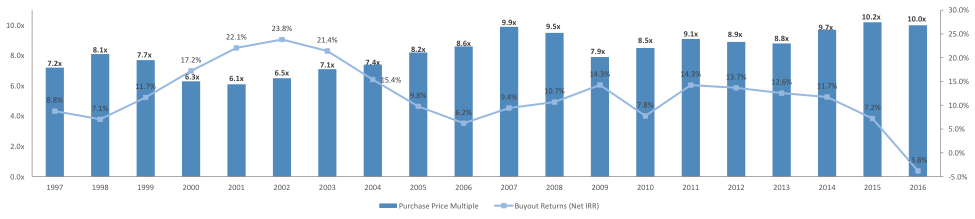
2. Pricing Matters – When entry multiples exceed 8x-9x EBITDA, corresponding vintage years suffer in performance, as seen when overlaying average entry multiples with the median net IRRs of a given vintage year (Figure 2). Though even in years of lesser performance, buyout still generates 6-8 percent IRR.
When entry multiples exceed 8x-9x EBITDA, I gravitate away from “mainstream” buyout managers in favor of “value-oriented” players who pay less than 8x. Over the past four years, as the market paid 10x-10.5x EBITDA or more, our value-oriented managers have paid 6.2x. These managers have done so by undertaking complex deals (corporate carve-outs, roll-up strategies, etc.), straying off the beaten path geographically or moving into distressed companies and industries.
Figure 2 – Pricing Matters
Source: Standard & Poor’s Capital IQ; State Street
3. Sector Focus Is Important – Sector-focused funds outperform generalists, according to industry data (Figure 3).
First, consider that companies backed by private equity generate 4.5 percent higher operating profits than non-PE backed firms, according to Playing to Their Strengths?, a study by the faculty from the University of Bologna and the University of Birmingham (Cressey, Munari, and Malipiero). If you break those private equity shops into sector specialists and generalists, the sector-focused PE-backed companies produce 8.5 percent higher operating profits than the generalist backers: 23.2 percent gross IRR versus 17.5 percent, respectively.
When making a hiring decision, I prefer to invest alongside an operational insider, entrepreneur or king-maker over a generalist who dabbles in a variety of sectors.
Figure 3 – Sector Outperformance

Source: Thomson Venture Economics; Bureau Van Djik; Cambridge Associates
4. Math Does Not Lie – Too often private equity is invested qualitatively. I made the following quantitative observations over the years:
- Probabilities of Fund-Level Losses by Sub-category – The probability of loss (returning less than a 1x) across various categories of private equity is fairly interesting:
- Secondaries: 1.5 percent
- Buyout: 19.4 percent
- Venture: 52.9 percent
If you want to take a dart board approach to manager selection, you are best served by secondaries. In contrast, investors should be extremely selective when investing in venture capital.
Figure 4 – Probability Of Less Than 1.0x At The Fund-Level

Source: Preqin; Cambridge Associates
- Average Deal-Level Loss Rates – Looking at the percentage of portfolio companies that do not produce an outcome of 1x or greater, the industry results are interesting:
- Buyout: On the average, buyout funds tend to generate losses on 20-25 percent of its portfolio companies.
- Venture: Depending on the data set, losses on 50-60 percent of portfolio companies are standard.
- 1.7x Risk Free? – If institutional investors are consistent investors in private equity –– i.e. buying a set number of funds over a mix of vintage years –– there is zero probability that the entire allocation will produce less than a 1x return.
The expected return is 1.7x (Figure 5). With more concentration, expected returns decrease to 1.5x or lower and the probability of loss increases.
This seems to be a constant tug of war, as many headlines have been written about and many CIOs have bought into the “less is more” approach. While I do not advocate having 4-5 managers doing the same thing, I am not opposed to doing 12-15 funds in a particular vintage year. Why place arbitrary restrictions on the portfolio?
Figure 5 – Invested Capital At Risk

Source: Capital Dynamics
- Secondaries’ Superior Information Ratio – Secondaries have an average median net IRR of 15 percent, compared with 12.8 percent for buyout. With such a tight band of outcomes, manager selection matters less in secondaries. Save your manager selection skills, time and resources to pick the best venture and buyout managers.
If an investor is only able to access median-performing buyout managers, they may be better served by dramatically reducing or eliminating their buyout allocation in favor of secondaries, which largely consist of buyout exposure.
For such an investor, it may be a smarter approach to be conservative with a bulk of the portfolio and attempt to seek attractive emerging buyout managers for alpha. In fact, if all you did is invest in two or three secondaries funds in each vintage year, you would have top-quartile performance and would outperform many world-leading endowments.
For such an investor, it may be a smarter approach to be conservative with a bulk of the portfolio and attempt to seek attractive emerging buyout managers for alpha. In fact, if all you did is invest in two or three secondaries funds in each vintage year, you would have top-quartile performance and would outperform many world-leading endowments.
- VC Does Not Have To Be High Risk – For your average Series A+ venture capital investor (e.g. institutional, not seed/angel investors), losses on over half of the portfolio companies are expected. These losses are offset with one or two high-flying breakouts that end up returning the cost of the entire fund (Trusted Insight’s 4 Laws of Venture Capital explains this phenomena).
Unfortunately, during market headwinds when the breakout deals are unavailable, venture returns slump to positive or negative single-digit net IRRs. However, the more I have invested into top-tier (hard to access) venture firms, I have found that you can have both.
The best venture firms not only have the ability to invest in breakouts, but they also lose much less frequently. Whether it be due to information asymmetry, having better investment teams, learning to read market signals more accurately (running against the herd) or X-factor, our best venture managers lose only 15-20 percent of the time, compared to our buyout managers, who lose 20-25 percent of the time.
- Time Weighted Returns Versus IRR – What is the most important performance measurement to assess the quality of a manager’s portfolio? Ask any private equity professional, and they will tell you: IRR.
However, our numbers are also assessed on a time-weighted basis. So, it’s important to construct a portfolio that can perform in a net IRR world and a time-weighted one as well. This is easier said than done and perhaps gives another nod to secondaries.
5. Dollar Cost Averaging Is Key to Risk Mitigation – Inherently, institutional investors are forced into dollar cost averaging when consistently participating across the vintage years of private equity.
Studies have shown that the only loss-making allocators to private equity are those that either consciously attempt to time the market or lose the stomach or liquidity to maintain disciplined consistency.
There are times, like now, where every article and consultant might make a persuasive argument against participating in the 2017-2018 vintages, however, data supports that there are always attractive strategies and managers to select in each vintage. Why would you chose to sit on the sidelines, creating more risk for your program? Why not consider other strategies that benefit from dislocation, such as turnaround buyout, distressed or special situations?
Portfolio Construction Is Key to Alpha Generation, Pitfalls To Avoid – Manager selection, consistent participation and a thoughtful approach to portfolio construction are the totality of the limited control a limited partner has over alpha generation. The biggest mistakes I have seen institutional investors make are in beginning to believe that an LP is smarter than the GP; attempting to time the market; or following the herd when it comes to portfolio construction.
Given these investment principles, a sound way to approach portfolio construction is to consider the following:
- Base Layer – The base layer can be defined as private equity strategies that possess a low probability of losses, a relatively tight band of outcomes, yet still have the opportunity to generate 12-18 percent net IRRs, or anything above the average median net IRRs of buyout and venture strategies.
The desired base layer allocation depends largely on the level of accessibility an investor has to top-quartile venture capital and buyout managers, as well as the size and scale of the private equity allocation and risk-appetite of management. In my earlier example, if secondary funds have historically provided less than a 1.5 percent probability of loss and an average median net IRR of 15 percent, then an institutional investor should not even consider investing into buyout or venture capital if all they have available to them are median performers.
- Buyout – While the average institutional investor allocates 62 percent of its private equity allocation to buyout, this may not necessarily make sense for all investors.
This allocation should depend largely on the quality of managers accessible by the investor, the return expectations for its private equity allocation, the market environment, the youth/maturity of a program and other parameters that may be preferred by management (i.e. number of managers/funds, patience for quantifiable results, cost sensitivity).
Because manager selection has the ability to generate significant results (850 bps additional return for top-quartile over the median), if an investor has the ability to access and select top-quartile buyout managers, they may be interested in doing more, not less. If not, or if there are concerns about risk, market conditions or other matters, an investor may be better served to allocate more to the base layer than to buyout.
- Venture Capital/Growth Capital – Venture capital is a category where, with a probability of loss of 52.9 percent and an average median net IRR of 10.4 percent, if an investor cannot access the top-quartile managers, it should not even be pursued. Since returns are persistent, investors shut out of top-tier venture managers should focus on building a promising emerging manager program, attempting to access a future top-quartile performer. Go top quartile or go home.
Jon Nieman is head of private equity for the investment management department of the world's largest company and previously co-founded the corporate venture capital arm of the same firm. Mr. Nieman is a Trusted Insight contributing author.
This column does not necessarily reflect the opinions or views of the editorial board, Trusted Insight, Inc., Trusted Insight Platform Fund, its owners or any affiliates thereof (collectively, “Trusted Insight”). Any opinions or views expressed are solely those of the contributing author. You should not treat any opinion expressed herein as investment advice or as a recommendation to make an investment in any particular investment strategy or investment product. Nothing herein constitutes research by Trusted Insight. Furthermore, Trusted Insight does not warrant the completeness or accuracy of the information upon which this column is based.